📚🕵🏻Mastering Experimentation: How Design of Experiment Drives Innovation and Efficiency
- Fiona Ling
- Jan 31, 2025
- 11 min read

Updated: Feb 2, 2025
✨Hello ☆*: .。. o(≧▽≦)o .。.:*☆ ✨ I'm back with more things to yap
This time, it’s going to be a bit more challenging. However, it’s a powerful skill that will greatly benefit us in the long run when conducting experiments.
Ever felt stuck running endless experiments, changing one thing at a time, and hoping for the best?
That’s where Design of Experiment (DOE) comes to the rescue! Instead of guessing, DOE gives us a smart, structured way to test multiple factors at once, analyze their impact, and find the best solution—fast and efficiently ‼️
As a chemical engineering student, learning DOE has completely changed the way I approach problem-solving. It’s not just about labs and coursework—it’s a powerful skill used in industries like pharmaceuticals, energy, and manufacturing to improve processes, reduce waste, and boost innovation.
In this blog, I’ll share how DOE has transformed my learning experience, why it’s essential for future engineers, and how it can be applied beyond the classroom to solve real-world challenges.
First, let me demonstrate how I applied DOE in this case study and its impact on the popcorn experiment 🍿
Popcorn Crisis and how to solve it⁉️
Microwaving popcorn seems easy, right?
But if you've ever made it, you know that not every kernel pops perfectly. Some always stay unpopped at the bottom of the bag, like little "bullets."
The inedible "bullets" refer to the un-popped kernels.
So, what exactly causes this to happen?
In this case study, we will examine how these three factors could potentially affect the remaining number of "bullets."
Factor A: Diameter of bowls to contain the corn, 10 cm (-) and 15 cm (+)
Factor B: Microwaving time, 4 minutes (-) and 6 minutes (+)
Factor C: Power setting of microwave, 75% (-) and 100% (+)
8 runs were performed with 100 grams of corn used in every experiments and the measured variable is the amount of “bullets” formed in grams and data collected are shown below:
Run Order | A | B | C | Bullets (grams) |
1 | + | - | - | 3.50 |
2 | - | + | - | 2.50 |
3 | - | - | + | 0.74 |
4 | + | + | - | 1.50 |
5 | + | - | + | 0.95 |
6 | + | + | + | 0.32 |
7 | - | + | + | 0.50 |
8 | - | - | - | 3.12 |
Table 1: Data collected for full factorial design
🌿Full Factorial Design 🌿
To achieve a more accurate dataset, each run order with a different arrangement of factors should ideally be conducted eight times.
However, for this case study, there are some limitations for me to conduct the experiment in real life, so I will use data that is provided.
Step 1: Calculate the average number when each factor is at it's high or low level & the total effect
(1) For every factor, identify the runs where factor is "+" and "-" respectively.
(2) Sum up all the numbers for each levels and find the average.
(3) Perform minus between that two average number from each factor and obtain the total effect.

Step 2: Draw a graph for data analysis
With all the average numbers, draw a graph to show the significance of each factors.

Ranking the significance of factor: ❣️
Power > Microwaving Time > Diameter of Bowl
By analysing the absolute values of the gradients obtained from the graphical method, the significance of the factors affecting the number of "bullets" remain can be ranked.
The most significant factor is the power. This is evident from the absolute value of its gradient, which is -2.03, the highest among all factors. When the power is varied from low (-) to high (+), the number of "bullets" remain shows the greatest change.
The following will be microwaving time and diameter of bowl being the least significant.
This observation confirms that a steeper slope on the graph indicates a stronger influence of that factor on the amount of bullets present.
⋅•⋅⊰∙∘☽༓☾∘∙⊱⋅•⋅
When testing something, it's not just about looking at one factor at a time.
Sometimes, two things work differently when they are together—like how sugar and lemon make lemonade taste better, but just one alone wouldn’t be as good. If we ignore these interactions, we might miss the best results or make wrong decisions.
By studying how factors affect each other, we can find smarter ways to improve things and get the best outcome!
Step 3: Identify the interaction between each pairs of factors
For all different pairs of interaction, the calculation and graphical parts are similar. Hence, I will only give a detailed explanation for interaction A x B only
🌻Interaction (A x B) 🌻
Now, I will first analyze the interaction between factor A and B. In the graph.
When selecting the data from table 1, first is to chose the data when B is at low level following with the A being low or high respectively. Put in the value in the table beside the graph below. Do the same for the data when B is at high level.
Create a graph that show the interaction between both factors.
There will be two lines. One being when factor B is at low level, another one is when factor is at high level. X-axis indicate the levels of factor A. With the graph being drawn, we will be able to analyze the interaction between each of them.

The gradients of both lines are different, one is positive while the other is negative, hence there is significant interaction between A and B.
🌷Interaction (A x C) 🌷
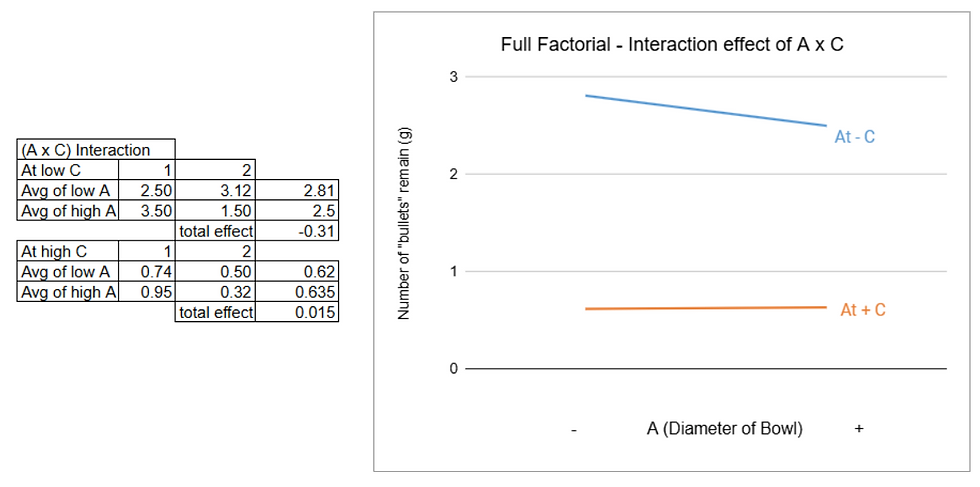
The gradients of both lines are different, one is positive (near to zero) while the other is negative, hence there is significant interaction between A and C.
🌼Interaction (B x C) 🌼

The gradients of both lines are slightly different, both are negative but of different value, hence there may be some interaction between A and B but it is small.
˚₊‧꒰ა . ——— ˗ˏˋ ✮ ˎˊ˗ ——— ˖ ໒꒱ ‧₊˚
🌿Conclusion✨
From the 3 graph about the interaction of factors, we can see that only when factor C (power) is included in the interaction, the number of "bullets" remain experience the largest change. For both interaction (A x C) and (B x C), when factor C is at low level, the number of "bullets" will be more than 2. When factor C is at high level, the number of "bullets" will stay below 1 no matter what is the other interacted factor is. Hence, it is concluded that factor C has the most significant effect on the experiment and should be at high level to achieve the least number of "bullets".
From graph for interaction of (B x C), the number of bullets achieved the lowest number among all data point that is 0.41 when C and B are at high level. From the graph for interaction of (A x B), the number of bullets achieved lowest in that graph that is 0.91 when A and B are at high level.
However, from the graph for interaction of (A x C), the number of bullets was not affected much in the high C level, when A increase from low to high. Thus, when only considering factors A and C, C will not be affected by A that much.
Hence, from the full factorial design method, to achieve the least number of "bullets", factor C should be at high level (100&), factor B at high level (6 mins) and factor A at high level (15 cm).
🌿Fractional Factorial Design 🌿
If each experiment is conducted 8 times, the experiment will be performed a total of 64 times‼️Too much to handle...
When dealing with multiple factors, researchers often opt for fractional factorial design instead of a full factorial approach, and for good reason. Testing every possible combination in a full factorial design can quickly become overwhelming, consuming time, effort, and resources.
Fractional factorial design provides a smarter, more efficient alternative. By carefully selecting a subset of combinations, it still reveals valuable insights while reducing unnecessary experiments. This method identifies the most influential factors and interactions without the excess cost and complexity. In short, it’s a practical, time-saving approach that delivers meaningful results but with a risk of missing information.
˗ˏˋ ♡ ˎˊ˗
First, we will need to chose the suitable combination of factors to achieve a accurate data analysis.

Choosing the right set of experiments in fractional factorial design depends on statistical orthogonality. This concept ensures that the selected experiments yield balanced and unbiased results. Orthogonality means that the factors and their interactions are evenly distributed and uncorrelated, allowing us to analyze their effects accurately without testing every possible combination.
Here are the combination of factors that are chosen:
Run Order | A | B | C | Bullets (grams) |
1 | + | - | - | 3.50 |
2 | - | + | - | 2.50 |
3 | - | - | + | 0.74 |
6 | + | + | + | 0.32 |
Table 2: Data set for fractional factorial design
Let's do the fractional factorial design with the same steps as full factorial design !
Step 1: Calculate the average number when each factor is at it's high or low level & the total effect

Step 2: Draw a graph for data analysis

Ranking the significance of factor: ❣️
Power > Microwaving Time > Diameter of Bowl
By analysing the absolute values of the gradients obtained from the graphical method, the significance of the factors affecting the number of "bullets" remain can be ranked.
The most significant factor is the power. This is evident from the absolute value of its gradient, which is -2.47, the highest value among all factors. When the power is varied from low (-) to high (+), the number of "bullets" remain shows the greatest change.
The following will be microwaving time and diameter of bowl being the least significant.
Step 3: Identify the interaction between each pairs of factors
Here, we will be doing the same calculation steps as full factorial design.
🌻Interaction (A x B) 🌻

The gradients of both lines are different, one is positive while the other is negative, hence there is significant interaction between A and B.
🌷Interaction (A x C) 🌷
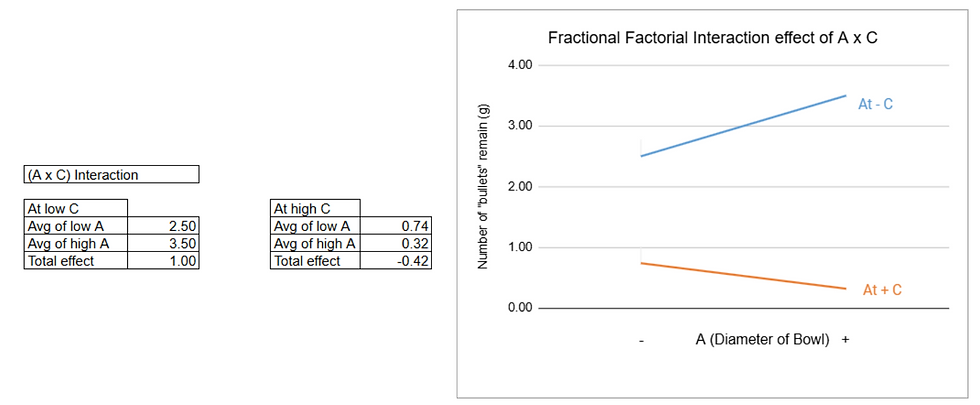
The gradients of both lines are different, one is positive while the other is negative, hence there is significant interaction between A and C.
🌼Interaction (B x C) 🌼

The gradients of both lines are slightly different, both are negative but of different value, hence there may be some interaction between A and B but it is small.
˚₊‧꒰ა . ——— ˗ˏˋ ✮ ˎˊ˗ ——— ˖ ໒꒱ ‧₊˚
🌿Conclusion✨
Through fractional factorial design, we still achieve the same result regarding the ranking and the interaction between each factors.
Mostly when the factor increase from low to high levels, the number of "bullets" remains wil decrease. However, this is not the case for some.
From the graph for interaction (A x B), when B is at low level, increase in bowl diameter will increase the number of "bullets".
From the graph for interaction (A x C), when C is at low level, increase in bowl diameter increase the number of "bullets".
Like why is it like this I wonder.....
This is my own assumption, but I guess with the increase of bowl diameter, there is more heat loss to the bowl rather than the kennel. When the bowl is smaller, there is a more concentrated heat distribution that make sure all the kennel can be popped.
This experiment isn’t just about popcorn—it’s a fun way to understand how cooking works! Things like how heat spreads, how much energy is used, and how long food is cooked all affect the final result. These same ideas apply to baking cookies, roasting vegetables, or even large-scale food production. When we learn how different factors work together, we can make better, tastier food—whether in our kitchen or in big food factories!
🌼My reflection on the DOE learning experience🌠
During the tutorial lesson, I felt overwhelmed by all these numbers and graphs 📊 (it just didn't make sense to me back then) 😭
What makes me keep on going to spend more time understanding this topic? 🤔
Like how humans need a reason to keep moving forward, I told myself why it is important to make sure I understand how all these things work. 🌟
Only after this tutorial did I realize that there are a lot of factors that affect the results of those research studies. The real world is not like the ideal assumptions we often make in our practice papers; everything matters! 🌍
Based on what we learnt in the previous chemistry experiment, we will only study the effect of each factor separately (for example, the concentration, heating rate, etc.) 🔬 Now, we are connecting more factors together to see the impact on the whole system. 🌐
With the knowledge of DOE, I can ~
Improve Experimental Accuracy – Instead of trial and error, DOE ensures data-driven decision-making, minimizing errors and improving reliability in lab work. 🧪
Develop Analytical Thinking – By identifying key factors and understanding their impact, I learn how to break complex problems into manageable variables. 🧠
With the help of data and how to handle it, I can uncover more about my own findings in the future, whether it’s for projects or lab work! 🚀
DOE is that easy as I think as well :(
The Design of Experiments (DOE) can be a complex and labor-intensive approach. In our current experiment, we are only focusing on three factors, and even that presents significant challenges due to the overwhelming amount of data and numerous graphs that need to be analyzed. If we were to conduct an experiment involving more than three factors, the process of drawing conclusions would likely become even more chaotic and intricate.
Then, you might think "Why not use fractional factorial design instead?".
But the truth is, there's a risk of missing information and causing more confusion in our results. Not ideal for doing a research!
There's a trade-off if you are considering to use factorial method.
Therefore, the capacity to manage a large volume of detailed data is absolutely essential!
✨The main key takeaway✨
Learning by Experimenting and Making Smart Choices with Data
It's not just about popcorn, this experiment teaches the importance of scientific testing and data analysis. Instead of guessing the best way to make popcorn , this study follows a structured approach—testing variables, recording data, and drawing conclusions based on evidence. This is a valuable skill in many fields, from engineering and food science to business and research.
With this new approach, I am open to try new things!! I am hoping to use this skills in my final year project next year, where I am given a chance to do experiment and develop new ideas when solving a specific problem. With the data, we can use it to make informed decisions and apply in the real world problems.
Back to the example of this case study, it would be interesting to explore additional factors such as stirring the kernels mid-way, preheating the bowl, or using different types of popcorn kernels. This could provide deeper insights into optimizing popcorn popping efficiency even further. [This is for future experiment if I am making popcorn for a living 😉)
Ultimately, while making microwave popcorn may seem simple, this case study demonstrates how scientific experimentation can provide meaningful insights to improve everyday tasks.
Heads up for some disappointment if the factor is not something that you can't control
In the last practical, we were required to collect data on the distance of a flying projectile. From the data, we analyzed and came up with the conclusion of how each factor contributed to the flying distance. There was a group challenge where we needed to shoot down as many targets as possible that were at different distances.
Our plan was to measure the distance from the starting line to the target, find the closest distance from the data table, and set up the same catapult.
The result didn't happen as we wanted it to. In the end, we were just using our own feeling to gauge the distance of the catapult because our data was not helping.
Our conclusion was that there were a lot of other factors that affected the inaccuracy of the data. For example, the different catapults used, the launching strength of each one because of the rubber band (some were new and some were stretched). Lastly, the amount of strength used every time to launch the projectile was not consistent.
There are many more things I need to learn on how to conduct a reliable experiment and research. Long way to go but at least we are somewhere there!!
Thank you for taking the time to read my blog! 😊 I truly appreciate your patience as I shared my thoughts and insights. Your support means a lot to me. 💖 I hope to see you again for the final installment of this series. Until then, take care! 🌟
+ ° . ๑・° ⊹ . + ° . ๑・° ⊹ . + ° . ๑・° ⊹ . +


Comments